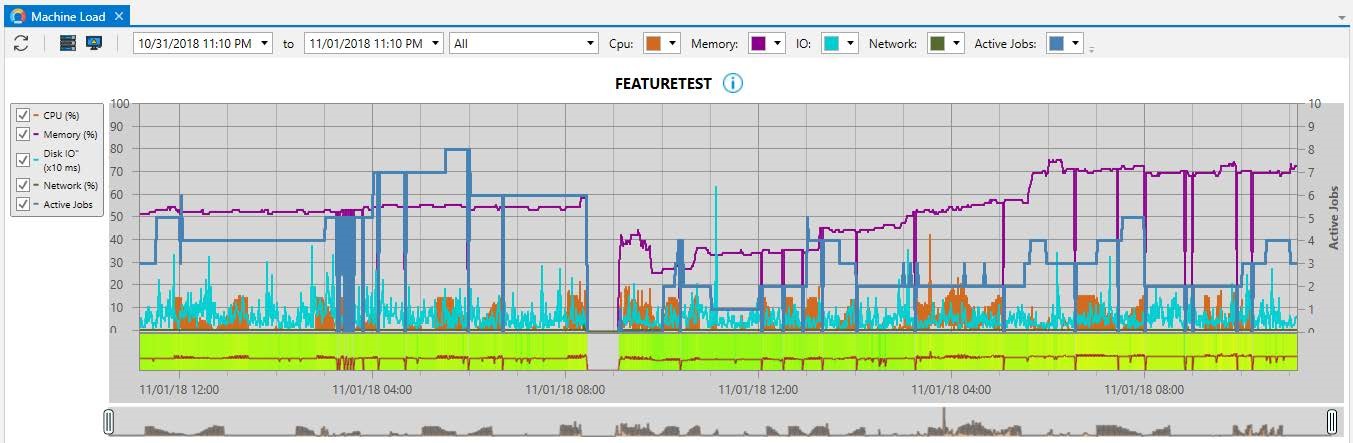
Machine Load
Machine Load View is a graphical display of Execution Agent![]() machines being utilized and their overall system utilization. Resource utilization displayed include: CPU, Memory, Disk Response Times, Network and ActiveBatch Jobs.
machines being utilized and their overall system utilization. Resource utilization displayed include: CPU, Memory, Disk Response Times, Network and ActiveBatch Jobs.
The purpose of Machine Load is to give you an idea as to how the Agent systems are faring performance-wise and to drill down to the actual executing Jobs. Machine Load View provides you with insight as to how a given machine is being utilized. It isn’t meant for comparing one system against another. Examining system performance can lead to either: (1) changing the Execution Queue for a given Job, and (2) associating a Job with a Generic Queue for better workload balancing of your server’s. Regardless of any changes you may make, Machine Load View provides greater insight into how your execution machines are performing. The display charts the critical hardware factors concerning machine performance along with the actual ActiveBatch Jobs that are currently running on that system by time of day.
The list of execution machines available to see in this view is taken from your Execution Queues Machine property and then coalesced into a single machine view. As an example, if you have three (3) Execution Queues that all reference the same machine, only that single machine will appear in the list.

The above image depicts the (partial) Machine Load toolbar. The first icon on the left is the Refresh operation. The next pair of icons allow you to edit the list of machines to be displayed in this view as well as display which Execution Queues appear to be inoperative. The next set of controls are a date/time begin/end which allows you to filter and refine the data you are to display by date and time. The next control is a dropdown that allows you to precisely control what is shown in the view. Finally, the next set of controls allow you to specify a color for each element that is being graphed.
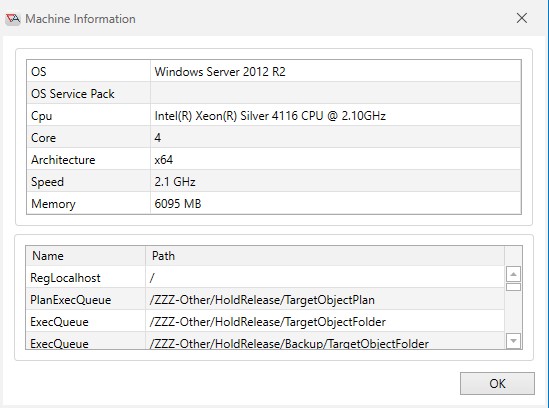
The information icon to the right of the Execution Agent's machine name can be clicked. When clicked, you will see software and hardware information specific to that machine, as depicted in the image below. In addition, a list of Execution Queues present on your Scheduler will be displayed. This allows you to easily locate those Queues referencing that machine.
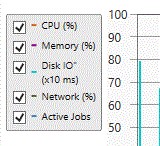
On the left-hand side of the Machine Load view, you will see the series of elements that are graphed by Machine Load (see image below). This includes CPU, Memory, Disk IO, Network and Active Jobs. Sometimes when a graph is very busy, it can be hard to distinguish one set of elements from another. The purpose of this legend is to allow you to show or hide the element by checking or unchecking the element.
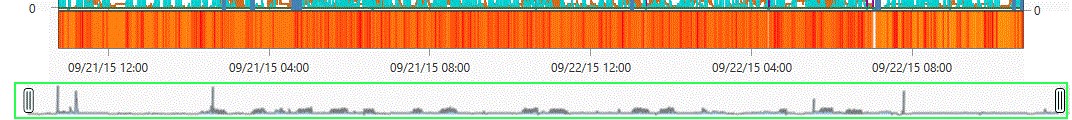
Next, in the below figure, the portion outlined in a green box and bounded by two paperclips, is the zoom area. The zoom area contains a compressed version of the graph. By moving one or both of the paperclips together you can zoom into the graph and change the scale. Conversely, when you move the paperclips apart, you zoom out.
The image below shows a zoomed-in portion of the Machine Load View. As you hover the cursor over the graph, you can retrieve the actual values for each performance element. This provides additional clarity as to how the system is performing. The Active Jobs element provides an additional capability, described below.
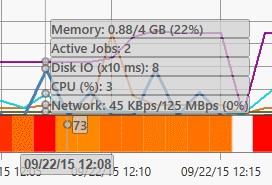
If you right-click on the small circle associated with the Active Jobs element, you can see the actual Jobs that were running, as displayed in the image below. This feature allows you to easily determine which Jobs were running and whether (if performance was an issue) other machines might be more suited to running the Job(s).
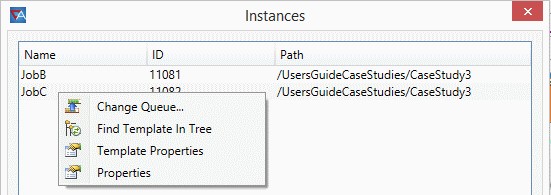
The figure above depicts two (2) Jobs that were running. Please note that if this execution machine is shared by other Job Schedulers, you will only see the Jobs dispatched by your currently connected Scheduler. This means that on occasion, you may see an Active Jobs value that results in less or no active Jobs actually displayed. Finally, right-clicking on one of the Jobs in the Instances list pulls up a menu of operations depicted in the above image. You can change the Job's Queue, find the Job template (definition) in the Object Navigation pane, access template properties, and access the instance properties.